Information about skycrapers in the world including their height, year of construction, city and country.
List of Skyscrapers with ranking of 1 - 30
| Rank | Building, City, Country | Year | Floors | Height | |
|---|---|---|---|---|---|
| m | ft | ||||
| 1. | Burj Khalifa, Dubai, The United Arab Emirates | 2010 | 163 | 828 | 2,717 |
| 2. | Taipei 101, Taipei, Taiwan | 2004 | 101 | 508 | 1,667 |
| 3. | Shanghai World Financial Center, Shanghai, China | 2008 | 101 | 492 | 1,614 |
| 4. | International Commercial Center, Hong Kong | 2010 | 108 | 484 | 1588 |
| 5. | Petronas Tower 1, Kuala Lumpur, Malaysia | 1998 | 88 | 452 | 1,483 |
| 5. | Petronas Tower 2, Kuala Lumpur, Malaysia | 1998 | 88 | 452 | 1,483 |
| 7. | Zifeng Tower, Nanjing, China | 2010 | 66 | 450 | 1476 |
| 8. | Willis Tower (formerly; Sears Tower), Chicago, USA. | 1974 | 108 | 442 | 1,451 |
| 9. | Guangzhou International Finance Center, China | 2010 | 103 | 439 | 1439 |
| 10. | Burj Milad , Tehran, Iran | 2007 | 12 | 435 | 1427 |
| 11. | Trump International Hotel & Tower, Chicago, USA | 2009 | 88 | 423 | 1389 |
| 12. | Jin Mao Building, Shanghai | 1999 | 88 | 421 | 1,381 |
| 13. | Two International Finance Centre, Hong Kong | 2003 | 88 | 415 | 1,362 |
| 14. | CITIC Plaza, Guangzhou, China | 1996 | 80 | 391 | 1,283 |
| 15. | Shun Hing Square, Shenzhen, China | 1996 | 69 | 384 | 1,260 |
| 16. | Empire State Building, New York | 1931 | 102 | 381 | 1,250 |
| 17. | Central Plaza, Hong Kong | 1992 | 78 | 374 | 1,227 |
| 18. | Bank of China, Hong Kong | 1989 | 70 | 367 | 1,205 |
| 19. | Bank of America Tower, New York. | 2009 | 55 | 366 | 1200 |
| 20. | Almas Tower, Dubai | 2008 | 68 | 360 | 1181 |
| 21. | Emirates Tower One, Dubai | 2000 | 54 | 356 | 1,163 |
| 22. | The Torch, Dubai | 2011 | 86 | 348 | 1142 |
| 22. | Tuntex Sky Tower, Kaohsiung, Taiwan | 1997 | 85 | 348 | 1,140 |
| 23. | Aon Centre, Chicago | 1973 | 80 | 346 | 1,136 |
| 24. | The Center, Hong Kong | 1998 | 73 | 346 | 1,135 |
| 25. | John Hancock Center, Chicago | 1969 | 100 | 344 | 1,127 |
| 26. | Tianjin World Financial Center, China | 2011 | 76 | 337 | 1105 |
| 27. | Shimao International Plaza, Shanghai, China | 2006 | 60 | 333 | 1094 |
| 28. | Rose Rayhaan, Dubai | 2007 | 72 | 333 | 1093 |
| 29. | Minsheng Bank Building, Wuhan, China | 2007 | 68 | 331 | 1,087 |
| 30. | Ryugyong Hotel, Pyongyang, N. Korea | 1995 | 105 | 330 | 1,083 |
NOTE: When a building is “topped out” (the point of construction
when the structure has met its proposed structural top), the
building is officially ranked and is placed on the list. UC
indicates under construction: although the building has been
“topped out,” construction has not been completed. Height is
measured from sidewalk level of main entrance to structural top of
building. This includes spires, but does not include antennas or
flagpoles.
1. World Trade Center twin towers of New York
City ranked fifth and sixth (at 1,368 ft and 1,362 ft) on this
list until their destruction on Sept. 11, 2001.
2. A building differs from a tower in that the
former is considered to be a structure that is designed for
residential, business, or manufacturing purposes. Also, an
essential characteristic of a building is that it has floors.
We have a collection of civil engineering resources for students, teachers and professionals. Select from the following links to get more information about civil engineering
More Solved Examples on different topics
Quiz on different areas of civil engineering
Study material on different topics
Structural Analysis
Basic concepts with different methods of analysis
Structural Design
Requirements of Design Process
Reinforced Concrete
Principles of analysis and design
Indeterminate Structures
Methods of solving
Slope & Deflection of beam
Basic concepts and methods
Analysis of Moving Loads
Influence Line and its applications
Irrigation Engineering
Fundamentals and different methods
Land Surveying
Principles and equipment used
Construction Management
CPM, PERT and dispute resolution
Civil Engineering Quiz
Test your knowledge on different topics of Civil Engineering
Geotechnical Engineering
Fundamentals for analysis and design
Hydraulic engineering
Fluid properties and equations
Research Papers
Research Papers, Thesis and Dissertation
Skyscrapers of the world
Containing Tall buildings worldwide
Forthcoming conferences
Listing of civil engineering conferences, seminar and workshops
Profile of Civil Engineers
Get to know about distinguished Civil Engineers
Professional Societies
Worldwide Civil Engineers Professional Societies
Keep visiting for getting updated or Join our mailing list to get updates
Please Tell your Friends about us
 Analysis of Frame by Moment Distribution method
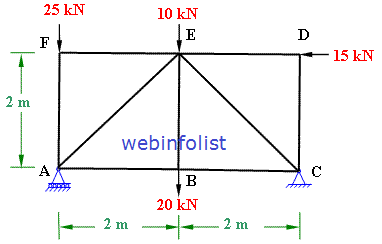 Determination of Truss member Forces
 Solving indeterminate beam by Moment distribution method
 Solving Indeterminate beam by slope-deflection equations
 SFD & BMD of overhanging beam